State Maps of USDA Plant Hardiness Zones
Find your USDA hardiness zone with state maps, ZIP lookup, and regional zone ranges. Updated 2023 map explained, plus microclimate tips.
Before you order a fruit tree, tuck a shrub into a foundation bed, or trust a perennial label at the nursery, you need one number: your USDA plant hardiness zone. That zone tells you whether a plant is likely to survive your typical coldest winter nights—not whether it will love your summer humidity, your soil, or your patio microclimate. The USDA Plant Hardiness Zone Map is the standard reference gardeners use, and the 2023 edition is the current version you should check rather than an old tag, catalog, or blog post still citing 2012 boundaries.
This guide walks you through what the zones measure, how to look yours up (ZIP code, interactive map, or state download), what changed in 2023, and how to use the number when you shop—without treating it as a complete climate profile for your yard.
What USDA Hardiness Zones Actually Measure
USDA hardiness zones are based on the average annual extreme minimum temperature at a location, calculated from 30 years of weather-station data. For the 2023 map, that window is 1991 through 2020, the same climate-normals period NOAA uses as its current baseline. Each year contributes one data point: the single coldest night recorded that winter. Those 30 coldest-night values are averaged, and the result is sorted into color bands on the map.
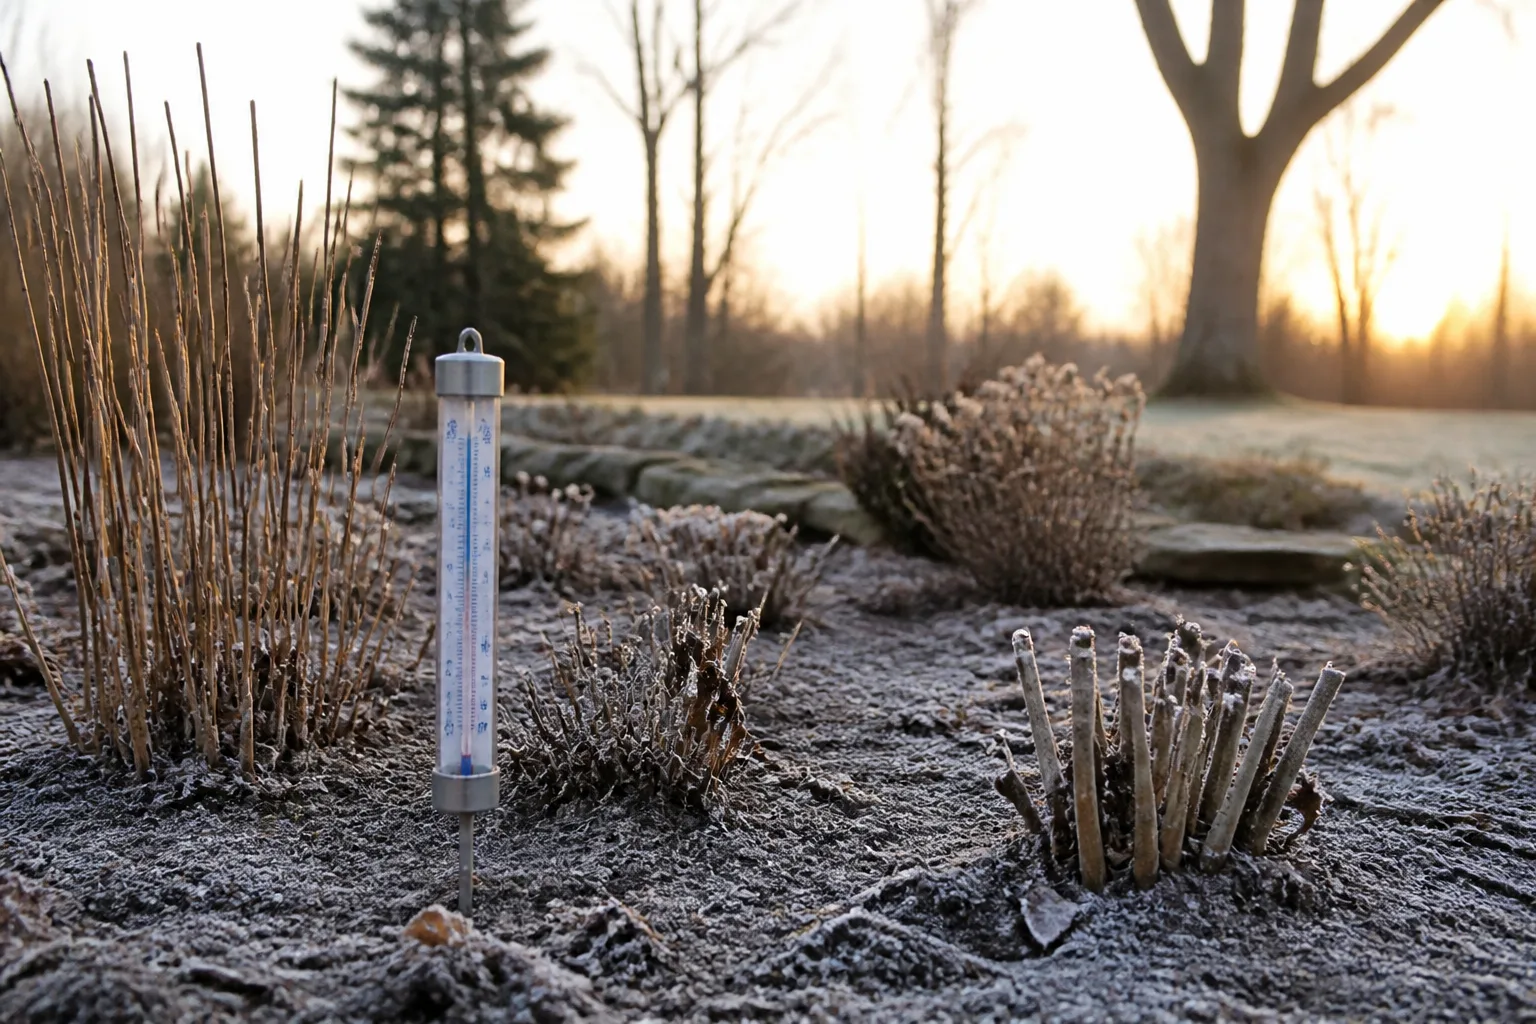
That is a narrower measurement than many gardeners assume. Your zone is not your average winter temperature, your total snowfall, or the lowest temperature your area has ever recorded. It is a long-term average of each year’s worst night—useful for predicting whether roots and dormant wood can survive repeated winter cold, but silent on almost everything else that affects plant health.
Average Extreme Minimum Temperature, Not Average Winter
Because the zone number is built from each year’s coldest night, it usually runs colder than a typical January low. One brutal outlier winter in the 30-year record counts the same as a mild one. That is intentional: plant labels describe cold tolerance, not comfort through an ordinary winter.
The continental United States spans roughly zones 3 through 10, divided into 13 numbered zones total when you include Alaska, Hawaii, Puerto Rico, and other territories. Zone 1 represents the coldest averages (around −60°F extreme minimum); zone 13 the warmest (around 65°F). Each full zone covers a 10°F band, then splits into half-zones labeled a (colder five degrees) and b (warmer five degrees). Zone 7a averages 0°F to 5°F; zone 7b averages 5°F to 10°F. That five-degree gap is often enough to decide whether a borderline shrub like a fig or rosemary survives as a permanent outdoor plant or needs protection.
How the 2023 Zone Map Differs From the 2012 Version
USDA released the current map in November 2023, the first full update since 2012. ARS and Oregon State University’s PRISM Climate Group built it from 13,412 weather stations, up from 7,983 in 2012, with finer GIS resolution—about half a mile per cell in the interactive version. Alaska’s rendering improved dramatically, from roughly 6¼ square miles per cell down to about ¼ square mile, capturing mountain-valley temperature inversions that older maps smoothed away.
You can use the map free online at planthardiness.ars.usda.gov. USDA also expanded the site with grower tips and downloadable state, regional, and national map files—what most gardeners mean when they search for state maps of USDA plant hardiness zones.
Why Half the Country Shifted to a Warmer Half-Zone
Compared with the 2012 map, about half of the United States moved into the next warmer half-zone (for example, 6a to 6b). The other half stayed in the same half-zone. Where a shift occurred, the change generally reflects 0 to 5°F of warming in the averaged extreme minimum. Some locations warmed within that range without crossing a half-zone boundary.
USDA attributes boundary changes primarily to the newer 30-year averaging period, more weather stations, and improved mapping methods—not solely to long-term climate change. Map developers cautioned that year-to-year variability in the single coldest night makes the zone map a poor standalone proof of global warming trends. Treat a half-zone nudge as updated data, not a forecast that every borderline plant will suddenly thrive outdoors.
Three Ways to Find Your USDA Zone
You do not need to eyeball a national poster and guess. Pick the method that matches how precisely you need the number.
ZIP Code Search on the Official Interactive Map
Fastest for most homeowners: open the USDA interactive map, enter your ZIP code in the quick-search box, and read the half-zone returned from the underlying grid. You can also click anywhere on the map to zoom down to neighborhood scale. This is more accurate than assuming your entire county shares one zone, because boundaries follow terrain and temperature patterns—not city limits.
If your address sits within a mile or two of a color change on the map, check both neighboring half-zones before you commit to a long-lived tree. Two lots on the same street can legitimately differ.
State and Regional Downloadable Maps
When you want a printable reference, wall chart, or offline copy for a community garden board, use USDA’s Map Downloads page at planthardiness.ars.usda.gov/pages/map-downloads. Files are free to download and print. State images follow a consistent naming pattern, for example:
- Alabama:
https://planthardiness.ars.usda.gov/system/files/AL150_HS.png - Oregon:
https://planthardiness.ars.usda.gov/system/files/OR150_HS.png
Replace the two-letter state code in that URL for your state. Large states are split: California has north (CA_N150_HS.png) and south (CA_S150_HS.png) maps; Texas has east (TX_E150_HS.png) and west (TX_W150_HS.png). Connecticut and Rhode Island share one file (CT_RI150_HS.png), as do Maryland and the District of Columbia (MD_DC150_HS_0.png).
National and regional poster files are also available at multiple resolutions from the same downloads hub. A paper version is not sold by the government; printing a downloaded file is the official route.
USDA Zone Ranges by State (Regional Reference)
State maps exist because a single national view hides local detail. Below is a regional zone-range reference for every state and territory covered on the USDA site. Ranges come from the 2023 state map legends. Use them to sanity-check your ZIP result, then open your state’s PNG for block-level detail.
Northeast and Mid-Atlantic State Zones
| State / territory | USDA zones represented |
|---|---|
| Connecticut | 6a–7b |
| Delaware | 7a–8a |
| District of Columbia | 5b–8a (see MD/DC map) |
| Maine | 3b–7a |
| Maryland | 5b–8a |
| Massachusetts | 5a–7b |
| New Hampshire | 3b–6b |
| New Jersey | 6b–8a |
| New York | 4a–7b |
| Pennsylvania | 5b–8a |
| Rhode Island | 6a–7b (see CT/RI map) |
| Vermont | 4a–6a |
| West Virginia | 5b–7a |
Coastal moderation and interior cold pockets explain much of the spread. A gardener in western Massachusetts may sit a full zone colder than a shoreline property an hour away.
Southeast and Gulf Coast State Zones
| State | USDA zones represented |
|---|---|
| Alabama | 7b–9b |
| Arkansas | 7a–8b |
| Florida | 8b–11b |
| Georgia | 6a–9b |
| Kentucky | 6b–7a |
| Louisiana | 8b–10b |
| Mississippi | 7b–9b |
| North Carolina | 6a–9a |
| South Carolina | 7b–9b |
| Tennessee | 6a–8a |
| Virginia | 5b–8b |
Florida and the Gulf Coast include the warmest continental zones gardeners routinely encounter. Northern pockets of the same state can still see hard freezes that surprise newcomers who looked only at a state average.
Midwest and Great Plains State Zones
| State | USDA zones represented |
|---|---|
| Illinois | 5a–7b |
| Indiana | 5b–7a |
| Iowa | 4b–6a |
| Kansas | 5b–7a |
| Michigan | 4a–6b |
| Minnesota | 3a–5a |
| Missouri | 5b–8a |
| Nebraska | 4a–6a |
| North Dakota | 3a–4b |
| Ohio | 5b–7a |
| Oklahoma | 6b–8a |
| South Dakota | 4a–5b |
| Wisconsin | 3b–6a |
Lake-effect snow and wind exposure can make a lakeshore lot behave differently from USDA’s grid cell even when the official zone matches. For cold-climate fruit and ornamental choices, pair your zone with cultivar-specific hardiness notes—see our guide to fruit trees that grow in cold climates for examples of pushing the lower edge responsibly.
Mountain West and Southwest State Zones
| State | USDA zones represented |
|---|---|
| Arizona | 5b–10a |
| Colorado | 3b–7b |
| Idaho | 3b–7b |
| Montana | 3a–6b |
| Nevada | 4a–10a |
| New Mexico | 5a–8b |
| Utah | 4a–9a |
| Wyoming | 3b–6a |
Elevation swings dominate here. A single county in Colorado or Utah can span several zones; that is why the interactive map and state PNGs matter more than memorizing a state “average.”
Pacific Coast, Alaska, Hawaii, and Territories
| State / territory | USDA zones represented |
|---|---|
| Alaska | 1a–8b |
| California (north) | 5a–10a |
| California (south) | 5a–11a |
| Hawaii | 8b–13a |
| Oregon | 5a–10a |
| Puerto Rico | 11b–13b |
| Washington | 4a–9b |
Alaska spans eight zones—more than any other state—because of latitude and terrain. Hawaii and Puerto Rico reach zones 12 and 13, where frost is not the limiting factor for most plants. Pacific Northwest gardeners in zone 8 share a number with parts of the humid Southeast but not the same summer heat stress; the zone label alone will not tell you which crops feel at home.
Reading Zone Numbers and Half-Zones on Plant Tags
Nursery tags and seed packets usually list a range (“hardy zones 5–8”) or a floor (“hardy to zone 6”). Read the number as a winter survival floor, not a performance guarantee. A plant rated zones 5–8 should survive typical winters in zone 5, but it may struggle in zone 8 summer heat even though the cold rating allows it.
When a tag lists only a single zone, check whether it means the full zone or a half-zone. “Zone 7” often implies 7a and 7b; picky breeders sometimes specify 7b minimum because that five-degree band matters for marginally hardy species.
| Half-zone | Approximate avg. annual extreme minimum |
|---|---|
| 3a / 3b | −40°F to −30°F |
| 4a / 4b | −30°F to −20°F |
| 5a / 5b | −20°F to −10°F |
| 6a / 6b | −10°F to 0°F |
| 7a / 7b | 0°F to 10°F |
| 8a / 8b | 10°F to 20°F |
| 9a / 9b | 20°F to 30°F |
| 10a / 10b | 30°F to 40°F |
If you are one half-zone colder than a plant’s rating, success may still be possible against a south-facing wall or with heavy mulch—but it is a gamble, not a label promise. If you are one half-zone warmer, the plant will usually survive winter; your risk shifts to heat, drought, or disease pressure instead.
What Your Zone Does Not Tell You
Hardiness zones answer one question: Can this plant survive the coldest typical winter night in my area? They do not answer when to plant tomatoes, whether your soil drains, or if your summers are too humid for a desert shrub.
Heat, Humidity, Snow Cover, and Frost Dates
Summer heat is a separate system. The American Horticultural Society’s Plant Heat Zone Map counts days above 86°F, the temperature at which many plants slow growth. A plant can be winter-hardy in zone 8 yet fail in a hot, humid zone 8 summer while thriving in cool-summer zone 8 Seattle.
Snow cover insulates crowns and roots. An open, snowless winter in zone 6 can kill plants that would have survived under a steady blanket, even though the air temperature matched the map.
Frost dates—last spring frost and first fall frost—govern planting calendars. They come from different statistical models than the hardiness map. Your zone might be 7b while your last frost still falls in mid-April, which changes when you direct-sow beans or set out peppers. For timing, use frost-date tools and our when to plant vegetables guide rather than the hardiness number alone.
Indoor seed starting also follows the calendar, not the zone map. If you start tomatoes indoors, your zone tells you whether the variety is perennial outdoors—not when to sow under lights. See how to start seeds indoors for schedule logic tied to frost dates.
Microclimates That Can Shift Your Real Zone
The USDA map describes a half-mile grid cell, not your specific 40-foot bed. Everyday landscape features can shift experienced cold by a full half-zone—or more.
Pavement and masonry store daytime heat and release it overnight. A foundation wall, brick patio, or driveway-adjacent bed often runs several degrees warmer than an open lawn on a clear, still night. That is why gardeners routinely keep rosemary or figs alive one zone north of their official rating against a south wall.
Slope and aspect matter. South-facing slopes warm faster; north slopes stay cooler and wetter. Elevation drops roughly 3.5°F per 1,000 feet of gain, which is why a mountain valley town can differ from a nearby ridge even on the same state map color.
Cold-air drainage creates frost pockets. Dense cold air flows downhill and pools in low spots, fence corners, and sunken beds. The thermometer at the bottom of your yard may read colder than the USDA cell assigned to your ZIP code.
A $10–15 min-max thermometer left in the bed you care about for one winter is often the most useful data you can collect. Compare your logged minimum to the official zone floor before you invest in a marginally hardy tree.
Using Zones When Buying Seeds, Shrubs, and Trees
Use your zone as a first filter, then refine with sun, soil, and local experience.
Woody plants and long-lived perennials: Stay at or below your zone rating unless you have a documented warm microclimate or a plan for winter protection. Replacing a dead tree is expensive; saving five dollars on a borderline shrub rarely pays off.
Annuals and tropicals sold as seasonal color: Tags may list warmer zones because the plant is not expected to survive winter. You can grow them as annuals in colder zones, or move pots indoors. Our guide on bringing potted plants indoors for winter covers which containers are worth the effort.
Seed packets: “Days to maturity” and sowing windows matter more than hardiness for annual vegetables. Hardiness on a packet usually refers to the parent plant’s winter survival, not the crop you harvest that same year.
Local nurseries: Reputable growers sometimes recommend half a zone conservative compared with the USDA map because they know local wet winters or wind exposure. Ask before you buy a questionable specimen.
When a plant is not hardy in your zone, you still have options: treat it as an annual, grow in a container and overwinter indoors, use heavy mulch and windbreaks for borderline perennials, or choose a hardier cultivar bred for your region.
Conclusion
Your USDA plant hardiness zone is the starting point for every perennial, shrub, and tree decision—not the finish line. Look it up on the official 2023 map with your ZIP code, confirm with your state’s downloadable PNG if you want block-level detail, and remember that the number describes average coldest-night temperatures from 1991–2020, split into 10°F zones and 5°F half-zones.
About half the country moved to a slightly warmer half-zone in the 2023 update; the rest did not. Either way, pair your zone with frost dates for planting timing, heat and humidity reality for summer performance, and on-site thermometer readings if walls, slopes, or frost pockets shape your yard. Used that way, the state maps and zone numbers save money and disappointment—without pretending one color band on a poster captures your whole garden.